Vega: Harnessing Volatility to Optimize Your Options Portfolio
Introduction
In the dynamic world of options trading, volatility isn't merely a risk—it's an opportunity waiting to be harnessed. Among the Greeks that govern options behavior, Vega stands as the guardian of volatility sensitivity, offering traders a powerful tool to transform market uncertainty into strategic advantage. While most traders focus on price direction through Delta or time decay via Theta, sophisticated portfolio managers understand that mastering Vega can unlock consistent profits regardless of market direction.
Think of Vega as your portfolio's "volatility compass"—it doesn't just tell you where volatility is heading, but more importantly, it quantifies exactly how much your positions will gain or lose when market uncertainty shifts. This precision transforms volatility from an unpredictable force into a measurable, tradeable asset class.
The importance of understanding Vega has never been greater. In today's markets, characterized by rapid information flow, algorithmic trading, and interconnected global economies, volatility patterns have become both more complex and more predictable for those who know how to read them. Earnings announcements can create volatility explosions, central bank meetings can compress implied volatility across entire markets, and geopolitical events can shift volatility regimes overnight.
Understanding Vega: The Volatility Greek
What is Vega?
Vega quantifies how much an option's price will change with a 1% change in implied volatility. Unlike Delta, which measures sensitivity to underlying price movements, or Gamma, which tracks the acceleration of those movements, Vega captures something more elusive yet equally important: the market's perception of future uncertainty.
Mathematically, Vega is represented as:
$$ \text{Vega} = \frac{\partial \text{Option Price}}{\partial \text{Implied Volatility}} $$
In practical terms, if an option has a Vega of 0.15, and implied volatility increases by 1%, the option price theoretically increases by $0.15. This relationship holds true regardless of whether you're holding calls or puts—both have positive Vega, meaning they benefit from increasing volatility.
The Unique Characteristics of Vega
Unlike the other Greeks, Vega exhibits several distinctive properties that make it both powerful and challenging to master:
Universal Positivity: Both calls and puts have positive Vega. This means that increasing implied volatility benefits all option holders, while decreasing volatility hurts all option positions. This characteristic makes Vega particularly useful for non-directional strategies.
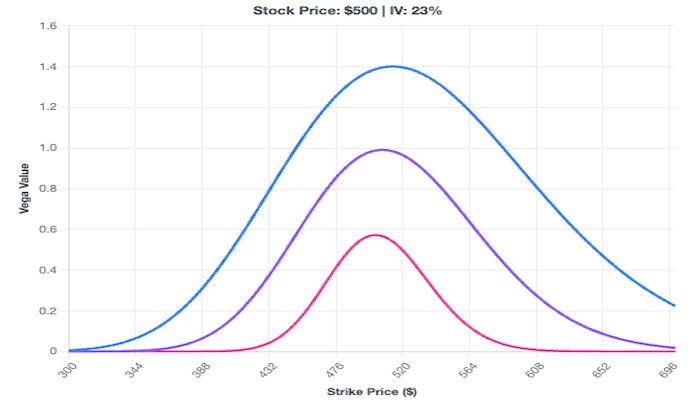
At-the-Money Supremacy: Vega peaks for at-the-money (ATM) options and decreases as options move deep in-the-money (ITM) or out-of-the-money (OTM). This creates a "Vega smile" similar to the volatility smile, where ATM options command the highest volatility premiums.
Time Sensitivity: Vega is higher for longer-dated options compared to short-term options. A six-month option might have a Vega of 0.40, while a one-week option on the same strike might have a Vega of only 0.05. This relationship reflects the reality that volatility has more time to impact longer-dated options.
Decay Acceleration: As expiration approaches, Vega doesn't just decrease—it collapses. The final 30 days before expiration see rapid Vega decay, with the most dramatic drops occurring in the final week.
The Mathematics Behind Vega
While the Black-Scholes formula provides the theoretical foundation for Vega calculations, understanding the practical implications is more important than memorizing formulas. Vega represents the partial derivative of the option price with respect to volatility:
Vega = ∂V/∂σ
Where:
- V = Option value
- σ = Implied volatility
The key insight is that Vega isn't just a number—it's a dynamic force that changes constantly based on market conditions, time to expiration, and the underlying asset's volatility characteristics.
Implied Volatility: The Heart of Vega
Understanding Implied Volatility
Implied volatility represents the market's collective expectation of future price movement, extracted from current option prices. Think of it as the market's "fear gauge" or "uncertainty index" for a specific stock or index. When traders expect significant price swings, they bid up option prices, driving implied volatility higher. When markets appear calm and predictable, implied volatility contracts.
The relationship between implied volatility and option prices is non-linear and dynamic. A 10% increase in implied volatility might increase option prices by 15-20% for ATM options, while the same volatility increase might only affect deep ITM options by 2-3%. This non-linearity creates opportunities for sophisticated traders who understand how to position themselves ahead of volatility changes.
Historical vs. Implied Volatility
Understanding the distinction between historical and implied volatility is crucial for Vega-based strategies:
Historical Volatility measures past price movements, typically calculated over 20, 30, or 252-day periods. It tells you what actually happened but doesn't predict future movements.
Implied Volatility represents forward-looking expectations embedded in option prices. It's what the market thinks will happen, not what has happened.
The spread between these two measures creates trading opportunities. When implied volatility is significantly higher than historical volatility, options may be overpriced, suggesting short Vega strategies. Conversely, when implied volatility is below historical averages, long Vega positions may be attractive.
Factors Affecting Implied Volatility
Market events create predictable patterns in implied volatility, offering systematic opportunities for Vega-aware traders:
Earnings Announcements: Implied volatility typically rises in the weeks leading up to earnings, as traders position for potential surprises. The "volatility crush" following earnings announcements can be dramatic, with IV dropping 30-50% overnight.
Economic Data Releases: Major economic announcements like Non-Farm Payrolls, Federal Reserve meetings, or GDP releases can cause broad-based volatility changes across multiple assets.
Sector-Specific Events: FDA approvals for biotech companies, oil inventory reports for energy stocks, or seasonal patterns in agricultural commodities create predictable volatility cycles.
Market Stress Events: Geopolitical tensions, financial crises, or unexpected market shocks can cause volatility to spike across all asset classes, creating what traders call "volatility storms."
The Volatility Surface: Smile and Skew
The volatility smile describes how implied volatility varies across different strike prices and expiration dates. This three-dimensional surface reveals market sentiment and creates opportunities for advanced Vega strategies:
At-the-money options typically have moderate implied volatility, representing the market's baseline expectation for future movement.
Out-of-the-money puts often have higher implied volatility than calls at equivalent distances from the current price. This "volatility skew" reflects the market's fear of downside moves and willingness to pay premium for portfolio protection.
Deep in-the-money options usually have lower implied volatility, as their prices are dominated by intrinsic value rather than time value.
Understanding the volatility surface allows traders to identify relatively cheap or expensive options across the entire strike and expiration spectrum, enabling more sophisticated Vega positioning.
Vega Behavior Across Different Option Characteristics
Strike Price Impact on Vega
The relationship between strike price and Vega follows predictable patterns that create strategic opportunities:
At-the-Money (ATM) Options: These options exhibit the highest Vega values because they have the maximum time value. A typical ATM option with 60 days to expiration might have a Vega of 0.25-0.35, making it highly sensitive to volatility changes.
In-the-Money (ITM) Options: As options move deeper ITM, their Vega decreases because a larger portion of their value comes from intrinsic value rather than time value. Deep ITM options might have Vega values of only 0.05-0.10.
Out-of-the-Money (OTM) Options: These options show moderate Vega values, higher than deep ITM options but lower than ATM options. However, OTM options provide significant leverage, as small volatility increases can cause large percentage gains.
Time to Expiration and Vega
The relationship between time and Vega is complex and critical for strategy selection:
Long-term Options (90+ days): These options have higher absolute Vega values and more stable Vega characteristics. They're ideal for traders who want to capitalize on sustained volatility changes without the pressure of rapid time decay.
Medium-term Options (30-90 days): This sweet spot offers a balance between Vega sensitivity and time efficiency. Many professional traders focus on this timeframe for core volatility strategies.
Short-term Options (< 30 days): While these options have lower absolute Vega, they can provide explosive returns when volatility spikes. However, Vega decay accelerates rapidly in the final weeks, requiring precise timing.
Vega Decay and Expiration Effects
As options approach expiration, Vega decay follows a predictable but accelerating pattern:
- 90-60 days: Vega remains relatively stable, declining slowly
- 60-30 days: Vega decay accelerates moderately
- 30-14 days: Vega decay becomes more pronounced
- 14-7 days: Rapid Vega collapse begins
- 7-0 days: Extreme Vega decay, with most options losing 80%+ of their Vega
This decay pattern creates opportunities for calendar spreads and other time-based volatility strategies.
Comprehensive Vega-Based Trading Strategies
Long Vega Strategies: Profiting from Rising Volatility
Long Vega strategies benefit from increasing implied volatility and are most effective when volatility is below historical averages or when specific events are likely to increase uncertainty.
Long Straddles and Strangles: The Volatility Powerhouses
Long Straddle Strategy: The long straddle represents the purest volatility play, involving the purchase of both a call and put at the same strike price (typically ATM).
Structure: Buy ATM call + Buy ATM put Vega Profile: High positive Vega (typically 0.50-0.80 for both options combined) Best Market Conditions: Low current volatility with expected increase Profit Potential: Unlimited in both directions Risk: Limited to premium paid
Example Setup:
- Stock trading at $100
- Buy $100 call (Vega: 0.30, Premium: $3.50)
- Buy $100 put (Vega: 0.30, Premium: $3.25)
- Total Investment: $675
- Combined Vega exposure: 0.60
If implied volatility increases by 5%, the position gains approximately $300 from Vega alone, before considering any directional movement.
Long Strangle Strategy: The strangle offers a lower-cost alternative to straddles by using OTM options.
Structure: Buy OTM call + Buy OTM put Vega Profile: Moderate positive Vega (typically 0.30-0.50 combined) Advantage: Lower cost than straddles Disadvantage: Requires larger price moves to profit
Strategic Considerations:
- Straddles work best when expecting volatility expansion with uncertain direction
- Strangles are more cost-effective but require larger moves
- Both strategies benefit from volatility increases even if the underlying stays relatively stable
Calendar Spreads: Time-Based Volatility Plays
Calendar spreads exploit differences in Vega between short-term and long-term options.
Structure: Sell short-term option + Buy longer-term option (same strike) Vega Profile: Net positive Vega Profit Mechanism: Long-term option gains more from volatility increases than short-term option loses
Example Calendar Spread:
- Sell 30-day $100 call (Vega: 0.15)
- Buy 90-day $100 call (Vega: 0.35)
- Net Vega: +0.20
As volatility increases, the 90-day option gains $0.35 per 1% volatility increase, while the 30-day option only costs $0.15, creating a net profit of $0.20 per 1% volatility increase.
Advanced Calendar Variations:
- Double Calendar: Calendars on both calls and puts
- Diagonal Calendar: Different strikes and expirations
- Ratio Calendar: Unequal numbers of long and short options
Volatility-Based Butterfly Spreads
Butterfly spreads can be structured to benefit from volatility changes while maintaining defined risk.
Long Butterfly (modified for Vega):
- Sell 2 ATM options
- Buy 1 ITM option
- Buy 1 OTM option
This structure creates negative Vega exposure, benefiting from volatility decreases.
Short Butterfly (Vega positive):
- Buy 2 ATM options
- Sell 1 ITM option
- Sell 1 OTM option
This creates positive Vega exposure while limiting risk.
Short Vega Strategies: Capitalizing on Volatility Contraction
Short Vega strategies profit from decreasing implied volatility and are most effective when volatility is elevated above historical norms.
Iron Condors: The Volatility Crusher
The Iron Condor is the most popular short Vega strategy, designed to profit from range-bound markets with declining volatility.
Structure:
- Sell OTM call
- Buy further OTM call
- Sell OTM put
- Buy further OTM put
Vega Profile: Negative Vega (typically -0.20 to -0.40) Ideal Conditions: High current volatility expected to decrease Maximum Profit: Net premium collected Maximum Risk: Difference between strikes minus premium collected
Example Iron Condor: Stock at $100, high volatility environment:
- Sell $105 call (collect $2.00)
- Buy $110 call (pay $0.75)
- Sell $95 put (collect $1.75)
- Buy $90 put (pay $0.50)
- Net credit: $2.50
- Net Vega: -0.30
If volatility decreases by 10%, the position gains approximately $300 from Vega contraction alone.
Iron Condor Management:
- Profit Taking: Close at 25-50% of maximum profit
- Loss Management: Close if underlying approaches short strikes
- Time Management: Most profitable in final 30-45 days
Vertical Credit Spreads: Directional Volatility Plays
Credit spreads combine directional bias with volatility benefits.
Call Credit Spread (Bearish):
- Sell lower strike call
- Buy higher strike call
- Benefits from falling volatility and falling/stable prices
Put Credit Spread (Bullish):
- Sell higher strike put
- Buy lower strike put
- Benefits from falling volatility and rising/stable prices
Strategic Advantages:
- Lower margin requirements than naked short options
- Defined risk profile
- Benefit from both directional movement and volatility contraction
Covered Calls and Cash-Secured Puts
These basic strategies have significant Vega components often overlooked by retail traders.
Covered Call Strategy:
- Long stock position
- Short call option
- Net Vega: Negative (from short call)
The short call creates negative Vega exposure, meaning the position benefits when volatility decreases. This makes covered calls most effective in high volatility environments where option premiums are elevated.
Cash-Secured Put Strategy:
- Hold cash equal to 100 shares
- Sell put option
- Net Vega: Negative
Like covered calls, cash-secured puts benefit from volatility decreases, making them most attractive when implied volatility is above historical averages.
Vega-Neutral Strategies: Eliminating Volatility Risk
Advanced traders often seek to eliminate Vega risk while focusing on other Greeks or market inefficiencies.
Delta-Gamma-Vega Neutral Portfolios
Creating truly neutral portfolios requires balancing multiple Greeks simultaneously:
Objectives:
- Delta neutral: Immune to small price movements
- Gamma neutral: Immune to acceleration in price movements
- Vega neutral: Immune to volatility changes
Implementation Challenges:
- Requires multiple option positions
- Constant rebalancing needed
- Higher transaction costs
- Complex risk management
Example Neutral Construction: Starting with a long straddle (positive Vega):
- Long $100 call (Delta: 0.50, Gamma: 0.03, Vega: 0.25)
- Long $100 put (Delta: -0.50, Gamma: 0.03, Vega: 0.25)
- Net position: Delta: 0, Gamma: 0.06, Vega: 0.50
To neutralize Vega, add short options with equal Vega:
- Sell 2 $105 calls (combined Vega: -0.30)
- Sell 2 $95 puts (combined Vega: -0.30)
- Adjust quantities to achieve Vega neutrality
Volatility Arbitrage
Professional traders often engage in volatility arbitrage, exploiting pricing inefficiencies between realized and implied volatility.
Concept: When implied volatility significantly exceeds expected realized volatility, short Vega positions can profit from the convergence.
Implementation:
- Establish short Vega position
- Delta hedge continuously
- Profit from volatility risk premium
This strategy requires sophisticated risk management and is typically reserved for institutional traders with advanced technology platforms.
Portfolio Vega Management and Risk Control
Measuring and Monitoring Portfolio Vega
Effective Vega management begins with accurate measurement and continuous monitoring of your portfolio's volatility exposure.
Portfolio Vega Calculation:
Portfolio Vega = Σ(Position Size × Option Vega × Multiplier)
For a portfolio containing multiple positions:
- Position 1: 10 contracts × 0.25 Vega × 100 = 250
- Position 2: -5 contracts × 0.30 Vega × 100 = -150
- Position 3: 8 contracts × 0.15 Vega × 100 = 120
- Net Portfolio Vega: 220
This means a 1% increase in implied volatility across all positions would increase the portfolio value by approximately $220.
Vega Budgeting and Position Sizing
Professional traders implement Vega budgets to control volatility risk:
Conservative Approach: Limit portfolio Vega to 1-2% of total portfolio value
Moderate Approach: Allow Vega exposure up to 3-5% of portfolio value
Aggressive Approach: Vega exposure of 5-10% for specialized volatility funds
Example Vega Budget: $100,000 portfolio with 3% Vega budget:
- Maximum Vega exposure: $3,000
- This allows for 3% volatility change to impact portfolio by maximum of 9%
Dynamic Hedging Techniques
As market conditions change, portfolio Vega must be actively managed through various hedging techniques.
Direct Vega Hedging
Add Offsetting Options: If portfolio has excessive long Vega exposure, add short Vega positions:
- Sell straddles or strangles
- Implement iron condors
- Write covered calls
VIX-Based Hedging: Use VIX options to hedge broad market volatility exposure:
- Long Vega equity portfolio + Short VIX calls
- Creates hedge against volatility contraction
- Particularly effective for portfolios correlated with broad market volatility
Indirect Vega Management
Time-Based Adjustments:
- Roll longer-dated options to shorter expirations (reduces Vega)
- Roll shorter-dated options to longer expirations (increases Vega)
Strike-Based Adjustments:
- Move strikes closer to ATM (increases Vega)
- Move strikes further from ATM (decreases Vega)
Position Size Modifications:
- Reduce position sizes to lower absolute Vega exposure
- Close most Vega-sensitive positions first
Risk Management Protocols
Effective Vega risk management requires systematic protocols and disciplined execution.
Daily Risk Monitoring
Key Metrics to Track:
- Current portfolio Vega exposure
- Vega exposure by underlying asset
- Correlation between Vega exposures
- Days to expiration for major positions
- Implied volatility levels vs. historical averages
Alert Systems:
- Portfolio Vega exceeds predetermined limits
- Individual position Vega concentration
- Correlation clustering warnings
- Volatility event calendar reminders
Volatility Event Management
Pre-Event Preparation: Before major volatility events (earnings, economic announcements):
- Review all positions affected by the event
- Calculate potential Vega impact scenarios
- Prepare adjustment strategies
- Set profit-taking and loss-cutting levels
During-Event Management:
- Monitor positions in real-time
- Execute predetermined adjustment strategies
- Avoid emotional decision-making
- Document lessons learned
Post-Event Analysis:
- Compare actual volatility changes to expectations
- Analyze strategy performance
- Identify areas for improvement
- Update volatility models and expectations
Advanced Vega Concepts and Applications
Second-Order Greeks: Vomma and Veta
Advanced Vega management requires understanding how Vega itself changes with market conditions.
Vomma (Volga): The Gamma of Vega
Vomma measures how Vega changes as implied volatility changes—essentially the second derivative of option price with respect to volatility.
Key Characteristics:
- Always positive for all options
- Highest for ATM options
- Important for large volatility moves
- Critical for volatility of volatility strategies
Practical Application: If an option has Vomma of 0.05 and Vega of 0.25:
- 1% volatility increase: Option gains $0.25 from Vega
- New Vega becomes: 0.25 + 0.05 = 0.30
- Subsequent 1% volatility increase: Option gains $0.30
This compounding effect makes Vomma crucial for managing positions through large volatility swings.
Veta: Vega's Time Decay
Veta measures how Vega changes with time passage, representing the time decay of volatility sensitivity.
Characteristics:
- Usually negative (Vega decreases over time)
- Accelerates as expiration approaches
- Highest for ATM options
- Critical for calendar spread management
Strategic Implications:
- Long-term options maintain Vega longer
- Short-term options experience rapid Veta decay
- Calendar spreads benefit from differential Veta
Cross-Asset Vega Correlations
Different underlying assets exhibit varying volatility characteristics and correlations, creating opportunities for sophisticated portfolio construction.
Equity Vega Characteristics
Individual Stock Options:
- Higher idiosyncratic volatility
- Earnings-driven volatility cycles
- Lower correlation with broad market volatility during company-specific events
- Higher Vega sensitivity to company-specific news
Index Options (SPY, QQQ, IWM):
- Strong correlation with VIX
- More predictable volatility patterns
- Better liquidity for large positions
- Systematic risk factors dominate
Commodity and Currency Vega
Commodity Options:
- Seasonal volatility patterns
- Weather and supply-driven volatility spikes
- Lower correlation with equity volatility
- Unique storage and transportation considerations
Currency Options:
- Central bank policy sensitivity
- Economic data driven volatility
- Carry trade implications
- International correlation effects
Volatility ETFs and Products
VIX-Based Products:
- VXX, UVXY for volatility exposure
- Contango and backwardation effects
- Roll yield considerations
- Correlation with equity Vega exposure
Technology and Systematic Vega Management
Modern Vega management increasingly relies on technology and systematic approaches.
Essential Technology Infrastructure
Real-Time Greeks Calculation:
- Live portfolio Vega monitoring
- Scenario analysis capabilities
- Stress testing tools
- Multi-asset correlation tracking
Risk Management Systems:
- Automated alert systems
- Position sizing algorithms
- Hedging recommendation engines
- Performance attribution analysis
Market Data Integration:
- Live implied volatility feeds
- Historical volatility databases
- Economic calendar integration
- News sentiment analysis
Algorithmic Vega Strategies
Volatility Momentum:
- Systematic strategies that buy volatility when it's rising
- Sell volatility when it's falling
- Risk-adjusted position sizing
- Transaction cost optimization
Mean Reversion Systems:
- Identify volatility extremes
- Systematic entry and exit rules
- Statistical significance testing
- Robust backtesting protocols
Volatility Arbitrage Algorithms:
- Real-time implied vs. realized volatility comparison
- Automated delta hedging
- Transaction cost modeling
- Risk-adjusted return optimization
Market Regimes and Adaptive Vega Strategies
Identifying Volatility Regimes
Successful Vega management requires recognizing different market volatility environments and adapting strategies accordingly.
Low Volatility Regimes
Characteristics:
- VIX below 15-20
- Compressed option premiums
- Range-bound market behavior
- Low realized volatility
- Complacent market sentiment
Optimal Vega Strategies:
- Long Vega positions (straddles, strangles)
- Calendar spreads favoring long-term options
- Volatility accumulation strategies
- Preparation for volatility expansion
Risk Considerations:
- Extended low volatility periods can persist longer than expected
- Carry costs of long Vega positions
- Potential for volatility to go even lower
High Volatility Regimes
Characteristics:
- VIX above 25-30
- Elevated option premiums
- Trending or highly erratic price movements
- High realized volatility
- Fearful market sentiment
Optimal Vega Strategies:
- Short Vega positions (iron condors, credit spreads)
- Premium collection strategies
- Volatility mean reversion plays
- Risk management focus
Risk Considerations:
- Volatility can spike higher than expected
- Gamma risk in short option positions
- Potential for sustained high volatility periods
Transitional Regimes
Characteristics:
- Volatility between 20-25 VIX levels
- Mixed market signals
- Uncertain directional bias
- Moderate option premiums
Adaptive Strategies:
- Flexible position sizing
- Mixed long and short Vega exposure
- Increased monitoring frequency
- Preparation for regime changes
Seasonal and Cyclical Vega Patterns
Understanding recurring volatility patterns provides systematic opportunities for Vega-based strategies.
Annual Volatility Cycles
January Effect: Increased volatility in early January due to portfolio rebalancing and tax-loss selling resolution.
Earnings Seasons: Quarterly periods of elevated volatility as companies report results:
- January: Q4 earnings
- April: Q1 earnings
- July: Q2 earnings
- October: Q3 earnings
Summer Doldrums: Typically lower volatility during summer months due to reduced trading activity.
September-October Volatility: Historically higher volatility as summer trading resumes and year-end positioning begins.
Economic Calendar Impact
Federal Reserve Meetings: FOMC meetings create predictable volatility patterns:
- Rising volatility leading up to meetings
- Volatility spikes immediately following announcements
- Gradual volatility decline in subsequent days
Economic Data Releases:
- Non-Farm Payrolls (first Friday of each month)
- CPI and PPI releases
- GDP announcements
- Consumer sentiment data
International Events:
- European Central Bank meetings
- Brexit-related developments
- Chinese economic data
- Geopolitical tensions
Sector-Specific Vega Opportunities
Different market sectors exhibit unique volatility characteristics, creating specialized Vega opportunities.
Technology Sector Volatility
Characteristics:
- High growth expectations create elevated volatility
- Earnings-driven volatility spikes
- Product launch and regulatory sensitivity
- Strong correlation with overall market volatility
Vega Strategies:
- Long Vega positions before earnings
- Short Vega strategies during stable growth periods
- Cross-sector volatility arbitrage
Healthcare and Biotech Volatility
Unique Factors:
- FDA approval binary events
- Clinical trial results
- Patent expiration impacts
- Regulatory environment changes
Specialized Strategies:
- Event-driven Vega strategies around FDA dates
- Long Vega positions during clinical trial periods
- Volatility arbitrage between large pharma and biotech
Financial Sector Volatility
Driving Factors:
- Interest rate sensitivity
- Regulatory changes
- Economic cycle correlation
- Credit risk perception
Strategic Approaches:
- Interest rate volatility hedging
- Credit spread volatility trading
- Regulatory event positioning
Real-World Case Studies and Applications
Case Study 1: Earnings Season Volatility Management
Background: Technology stock ABC trading at $150 with earnings announcement in 2 weeks. Current implied volatility at 45%, historical volatility at 35%.
Analysis:
- High implied volatility suggests expensive options
- Earnings typically cause 15-20% single-day moves
- Post-earnings volatility crush expected
Strategy Implementation:
-
Pre-Earnings (2 weeks out): Sell iron condor
- Sell $150 straddle (collect $8.50 premium)
- Buy $135/$165 protective wings (pay $2.25)
- Net credit: $6.25
- Net Vega: -0.85
-
Risk Management:
- Maximum loss if stock moves beyond wings: $8.75
- Breakeven points: $143.75 and $156.25
- Plan to close position immediately after earnings
Results:
- Stock moved from $150 to $148 on earnings
- Implied volatility dropped from 45% to 28%
- Volatility crush generated $4.25 profit
- Position closed for 68% of maximum profit
Key Lessons:
- Short Vega strategies can be highly effective around earnings
- Timing is crucial—enter 1-2 weeks before earnings
- Have predetermined exit strategies
- Volatility crush can be more profitable than directional movement
Case Study 2: Market Crash Vega Response
Background: Portfolio with significant long equity exposure during market stress event. VIX spiked from 18 to 45 over 3 days.
Initial Position:
- $500,000 equity portfolio
- Limited options exposure
- No volatility hedging
Crisis Response Strategy:
-
Immediate Action: Purchase protective puts
- Buy SPY puts 5% out-of-the-money
- Cost: $15,000 (3% of portfolio)
- Vega exposure: +1.25
-
Volatility Monetization: Sell call spreads
- Sell SPY call spreads 8% out-of-the-money
- Collect $8,500 premium
- Reduce net hedging cost
-
Dynamic Adjustment: As volatility peaked
- Close protective puts for profit
- Implement short Vega strategies expecting mean reversion
Results:
- Protective puts gained $35,000 as volatility spiked
- Equity losses limited to $125,000 (vs. $200,000 unhedged)
- Subsequent short Vega strategies profited $18,000 from mean reversion
- Net portfolio protection: 18.5% improvement
Strategic Insights:
- Volatility hedging can significantly reduce portfolio drawdowns
- Dynamic management of Vega exposure crucial during crises
- Volatility spikes create opportunities for both protection and profit
Case Study 3: Calendar Spread Volatility Arbitrage
Background: Stock XYZ showing divergent volatility between short-term and long-term options.
Market Setup:
- 30-day implied volatility: 22%
- 90-day implied volatility: 35%
- Historical volatility: 28%
- No upcoming earnings or events
Analysis:
- Long-term options appear expensive relative to short-term
- Calendar spread opportunity identified
- Expecting volatility normalization
Strategy:
-
Calendar Spread Construction:
- Sell 30-day $100 call (IV: 22%, Vega: 0.12)
- Buy 90-day $100 call (IV: 35%, Vega: 0.28)
- Net debit: $1.85
- Net Vega: +0.16
-
Thesis:
- Short-term volatility to increase toward long-term levels
- Long-term volatility to decrease toward historical average
- Time decay to benefit long-term option position
Management:
- Monitor volatility convergence daily
- Adjust position if underlying moves significantly
- Plan exit when volatility differential normalizes
Outcome:
- 30-day IV increased to 28% over 3 weeks
- 90-day IV decreased to 31% over same period
- Position gained $0.65 from volatility convergence
- Additional $0.35 gain from favorable time decay
- Total profit: $1.00 (54% return)
Key Takeaways:
- Volatility term structure provides systematic opportunities
- Calendar spreads can profit from volatility normalization
- Multiple profit sources: Vega convergence and time decay
- Requires patience and disciplined risk management
Building Your Vega-Aware Trading Framework
Phase 1: Foundation Building
Education and Skill Development: Start with comprehensive understanding of basic Vega concepts before advancing to complex strategies. Focus on:
- Option pricing fundamentals and the Black-Scholes framework
- Greeks interaction and portfolio-level effects
- Implied volatility calculation and interpretation
- Historical volatility analysis and forecasting
- Market microstructure and volatility dynamics
Paper Trading Development: Before risking capital, develop proficiency through simulated trading:
- Practice basic long and short Vega strategies
- Test volatility forecasting abilities
- Develop risk management reflexes
- Build confidence in strategy execution
- Document performance and learn from mistakes
Technology Setup: Invest in appropriate tools for Vega analysis:
- Real-time options data feeds
- Greeks calculation software
- Portfolio risk management systems
- Historical volatility databases
- Economic calendar integration
Phase 2: Strategy Implementation
Start Simple: Begin with basic strategies before advancing to complex combinations:
- Long Straddles: Master the fundamental volatility strategy
- Iron Condors: Learn short Vega risk management
- Calendar Spreads: Understand time-based volatility effects
- Credit Spreads: Combine directional and volatility views
Position Sizing Framework: Develop systematic approach to position sizing based on:
- Portfolio volatility budget (1-5% of total capital)
- Strategy-specific risk parameters
- Market volatility environment
- Correlation with existing positions
- Expected holding period
Risk Management Protocols: Establish clear rules before entering any position:
- Maximum loss tolerance per position
- Profit-taking guidelines (typically 25-50% of maximum profit)
- Time-based exit rules
- Volatility environment change triggers
- Portfolio-level risk limits
Phase 3: Advanced Integration
Multi-Strategy Coordination: As expertise develops, coordinate multiple Vega strategies:
- Balance long and short Vega exposures
- Coordinate across different time horizons
- Manage correlation between strategies
- Optimize portfolio-level risk-return profile
Dynamic Hedging Implementation: Develop capabilities for real-time portfolio adjustment:
- Automated Vega monitoring systems
- Pre-defined hedging triggers
- Efficient execution protocols
- Cost-benefit analysis frameworks
Performance Optimization: Continuously refine approach based on results:
- Strategy performance attribution analysis
- Market regime adaptation
- Technology upgrade cycles
- Education and skill enhancement
Common Vega Trading Pitfalls and Solutions
Mistake 1: Volatility Timing Errors
The Problem: Many traders attempt to time volatility peaks and troughs with precision, leading to premature entries and exits.
Common Manifestations:
- Buying volatility too early in low-volatility environments
- Selling volatility too early during market stress
- Expecting immediate mean reversion after volatility spikes
- Ignoring volatility momentum effects
Solutions:
- Use systematic entry and exit criteria rather than gut feelings
- Implement dollar-cost averaging for volatility exposure
- Study historical volatility persistence patterns
- Develop patience for volatility regime changes
Example Framework: Instead of trying to pick exact volatility tops and bottoms, use percentile rankings:
- Enter long Vega positions when IV is below 25th percentile of 252-day range
- Enter short Vega positions when IV is above 75th percentile of 252-day range
- Scale position sizes based on extremity of volatility levels
Mistake 2: Ignoring Correlation Clustering
The Problem: Accumulating similar Vega exposures across highly correlated positions, creating concentrated risk.
Hidden Correlations:
- Technology stocks during sector rotations
- Financial stocks during interest rate cycles
- Energy stocks during commodity price movements
- International stocks during currency crises
Risk Amplification: When correlated positions all experience volatility changes simultaneously, portfolio impact can be severe:
- Portfolio Vega exposure: 5 positions × 0.30 Vega each = 1.50 total Vega
- If positions are 90% correlated, effective Vega exposure ≈ 1.35
- During stress events, correlation can approach 1.0, maximizing losses
Solutions:
- Diversify across uncorrelated underlying assets
- Monitor rolling correlations between holdings
- Implement correlation-adjusted position sizing
- Use sector-neutral volatility strategies
Correlation Management Framework:
- Maximum 40% of Vega exposure in any single sector
- Monitor 60-day rolling correlations between major positions
- Reduce position sizes when correlations exceed 70%
- Implement cross-asset volatility strategies (equities, commodities, currencies)
Mistake 3: Inadequate Attention to Vega Decay
The Problem: Underestimating how rapidly Vega decays as expiration approaches, particularly in the final 30 days.
Vega Decay Timeline:
- 90 days to expiration: Vega stable
- 60 days to expiration: Slow Vega decay begins
- 30 days to expiration: Vega decay accelerates
- 14 days to expiration: Rapid Vega collapse
- 7 days to expiration: Extreme Vega decay
Impact on Strategies:
- Long Vega positions lose volatility sensitivity rapidly
- Calendar spreads experience changing risk profiles
- Short Vega positions face acceleration risk if volatility spikes
Solutions:
- Plan exits well before significant Vega decay
- Roll positions to maintain Vega exposure
- Use Vega decay calendars for timing decisions
- Implement time-based position adjustment triggers
Practical Guidelines:
- Close or roll long Vega positions at 45 days to expiration
- Monitor Vega decay rates weekly for positions under 60 days
- Increase monitoring frequency to daily under 30 days
- Never hold high Vega positions through final week unless expecting major events
Mistake 4: Event Risk Mismanagement
The Problem: Failing to account for scheduled and unscheduled events that can cause dramatic volatility changes.
Scheduled Events:
- Earnings announcements
- Federal Reserve meetings
- Economic data releases
- Product launches
- Clinical trial results
Unscheduled Events:
- Geopolitical developments
- Natural disasters
- Regulatory announcements
- Market flash crashes
- Company-specific news
Risk Scenarios:
- Holding short Vega positions through earnings announcements
- Long Vega positions during post-event volatility crush
- Ignoring macro events affecting entire sectors
- Underestimating binary event impacts
Comprehensive Event Management:
- Calendar Integration: Track all relevant events affecting your positions
- Position Adjustment: Reduce or hedge exposure before high-impact events
- Volatility Forecasting: Model expected volatility changes around events
- Scenario Planning: Prepare for multiple event outcomes
Event Risk Framework:
- Reduce Vega exposure by 50% within 3 days of major events
- Eliminate short Vega positions before binary events (FDA approvals, earnings surprises)
- Increase long Vega exposure 1-2 weeks before predictable volatility events
- Maintain emergency hedging protocols for unexpected events
Mistake 5: Overleveraging Vega Exposure
The Problem: Taking excessive Vega exposure relative to portfolio size and risk tolerance.
Leverage Amplification: Options naturally provide leverage, and Vega compounds this effect:
- 10% increase in volatility with 5.0 portfolio Vega = 50% portfolio impact
- During volatility storms, 20-30% volatility increases are possible
- High Vega exposure can cause portfolio destruction
Warning Signs:
- Portfolio Vega exceeding 10% of total capital
- Unable to sleep due to volatility concerns
- Making emotional adjustments to positions
- Ignoring risk management rules due to position size
Position Sizing Solutions:
- Maximum 5% of portfolio value in Vega exposure for aggressive traders
- Conservative traders should limit Vega to 2% of portfolio value
- Scale position sizes inverse to market volatility levels
- Implement stop-loss rules based on portfolio percentage losses
Leverage Management Framework:
- Calculate maximum theoretical portfolio loss under extreme volatility scenarios
- Ensure worst-case loss doesn't exceed 15% of total portfolio value
- Use Kelly Criterion concepts for optimal position sizing
- Regular stress testing under historical volatility extremes
Advanced Portfolio Construction with Vega
Multi-Asset Volatility Diversification
Creating robust Vega exposure requires understanding volatility relationships across different asset classes.
Equity Volatility Characteristics:
- High correlation during market stress
- Sector-specific volatility drivers
- Earnings seasonality effects
- Economic sensitivity variations
Fixed Income Volatility:
- Interest rate sensitivity
- Credit spread volatility
- Duration-based risk factors
- Central bank policy impacts
Commodity Volatility:
- Weather and supply shock sensitivity
- Seasonal demand patterns
- Currency correlation effects
- Storage and transportation costs
Currency Volatility:
- Central bank intervention risks
- Economic policy uncertainties
- Interest rate differential impacts
- Geopolitical event sensitivity
Diversification Benefits: By spreading Vega exposure across asset classes, traders can:
- Reduce correlation risk during market stress
- Capture unique volatility premiums in each market
- Create more stable volatility-based returns
- Improve risk-adjusted performance metrics
Factor-Based Vega Allocation
Modern portfolio construction increasingly uses factor-based approaches for Vega allocation.
Volatility Risk Factors:
- Term Structure: Short-term vs. long-term volatility exposure
- Skew: Put vs. call volatility differential
- Momentum: Trending vs. mean-reverting volatility
- Carry: High vs. low volatility premium assets
Factor Allocation Framework: Rather than selecting individual options, construct portfolio based on volatility factor exposures:
- 20% Term Structure: Calendar spreads capturing volatility term structure
- 25% Skew: Put-call ratio strategies exploiting volatility skew
- 30% Momentum: Trend-following volatility strategies
- 25% Carry: Premium collection from high volatility assets
Implementation Benefits:
- More systematic approach to Vega allocation
- Better risk-return optimization
- Reduced behavioral biases in strategy selection
- Enhanced diversification benefits
Dynamic Vega Allocation Models
Advanced practitioners use quantitative models for dynamic Vega allocation based on market conditions.
Regime-Based Allocation: Adjust Vega exposure based on identified market regimes:
Low Volatility Regime (VIX < 20):
- 60% long Vega exposure
- 30% Vega-neutral strategies
- 10% short Vega opportunistic
High Volatility Regime (VIX > 30):
- 20% long Vega exposure
- 30% Vega-neutral strategies
- 50% short Vega strategies
Transition Regime (VIX 20-30):
- 40% long Vega exposure
- 40% Vega-neutral strategies
- 20% short Vega strategies
Signal-Based Allocation: Use quantitative signals to determine optimal Vega exposure:
- Volatility Percentile Ranking: Increase long Vega when current IV below 25th percentile
- Term Structure Signal: Favor calendar spreads when term structure is steep
- Skew Signal: Exploit extreme skew conditions with targeted strategies
- Momentum Signal: Follow volatility trends with appropriate position sizing
Technology Integration and Systematic Approaches
Algorithmic Vega Management
Modern Vega strategies increasingly rely on algorithmic implementation for optimal execution and risk management.
Automated Greeks Monitoring:
- Real-time portfolio Vega calculation
- Correlation-adjusted risk metrics
- Scenario stress testing
- Alert systems for risk limit breaches
Dynamic Hedging Algorithms:
- Automated rebalancing triggers
- Optimal hedge ratio calculations
- Transaction cost optimization
- Slippage minimization protocols
Strategy Implementation Systems:
- Systematic entry and exit signals
- Position sizing algorithms
- Risk-adjusted return optimization
- Performance attribution analysis
Machine Learning Applications
Artificial intelligence and machine learning are revolutionizing Vega-based strategy development.
Volatility Forecasting Models:
- Neural networks for implied volatility prediction
- Ensemble methods combining multiple forecasting approaches
- Sentiment analysis integration for volatility expectations
- Economic data processing for systematic volatility drivers
Strategy Optimization:
- Genetic algorithms for optimal strategy parameter selection
- Reinforcement learning for adaptive position sizing
- Pattern recognition for volatility regime identification
- Natural language processing for event impact assessment
Risk Management Enhancement:
- Anomaly detection for unusual volatility patterns
- Correlation modeling using machine learning techniques
- Stress testing with Monte Carlo simulations
- Real-time adjustment algorithms for changing market conditions
Integration with Existing Portfolio Management
Successful Vega integration requires coordination with existing portfolio management processes.
Traditional Portfolio Integration:
- Correlation analysis with equity and fixed income holdings
- Risk budgeting across traditional and alternative strategies
- Performance attribution including Vega contributions
- Liquidity management considering options market characteristics
ESG and Sustainable Investing Considerations:
- Volatility strategies aligned with ESG principles
- Impact measurement of volatility-based returns
- Integration with sustainable investment mandates
- Consideration of ESG events on volatility patterns
Future Trends and Evolving Landscape
Regulatory Environment Evolution
The regulatory landscape for options and volatility trading continues to evolve, creating both challenges and opportunities.
Current Regulatory Trends:
- Increased transparency requirements for complex strategies
- Enhanced risk disclosure for retail options trading
- Systematic risk monitoring by regulatory bodies
- International coordination on derivatives regulation
Impact on Vega Strategies:
- Higher compliance costs for complex strategies
- Enhanced documentation requirements
- Potential restrictions on certain high-risk approaches
- Increased focus on investor suitability
Adaptation Strategies:
- Stay informed about regulatory developments
- Maintain robust documentation and compliance procedures
- Focus on strategies with clear risk profiles
- Engage with regulatory developments through industry participation
Technology Advancement Impact
Technological advancement continues to reshape volatility trading landscapes.
Artificial Intelligence Integration:
- Advanced pattern recognition in volatility data
- Improved forecasting accuracy through machine learning
- Automated strategy development and optimization
- Enhanced risk management through AI-powered systems
Blockchain and Distributed Ledger Applications:
- Transparent options pricing and settlement
- Decentralized volatility derivative markets
- Smart contracts for automated strategy execution
- Enhanced counterparty risk management
Quantum Computing Potential:
- Revolutionary option pricing model capabilities
- Complex portfolio optimization solutions
- Advanced risk scenario modeling
- Breakthrough volatility forecasting techniques
Market Structure Evolution
Options market structure continues to evolve, affecting Vega strategy implementation.
Electronic Market Making:
- Tighter bid-ask spreads reducing transaction costs
- Improved liquidity in previously illiquid options
- Enhanced price discovery mechanisms
- Increased market efficiency
Retail Participation Growth:
- Commission-free options trading platforms
- Simplified strategy implementation tools
- Educational resource proliferation
- Democratization of sophisticated strategies
Institutional Innovation:
- New volatility-based investment products
- Enhanced risk management tools
- Cross-asset volatility strategies
- Alternative data integration
Conclusion: Mastering the Art and Science of Vega
Vega represents more than just another Greek letter in the options trader's alphabet—it embodies the market's collective wisdom about uncertainty and provides a pathway to consistent profit generation regardless of market direction. Throughout this comprehensive exploration, we've discovered that mastering Vega requires both technical precision and strategic thinking, combining mathematical rigor with market intuition.
The journey from understanding basic Vega concepts to implementing sophisticated volatility strategies mirrors the evolution from reactive trading to proactive portfolio management. Those who simply react to volatility changes will always be at the mercy of market forces. However, traders who understand Vega's nuances can position themselves to benefit from volatility patterns, creating returns that are often uncorrelated with traditional investment approaches.
Key Principles for Vega Mastery
Systematic Approach: Successful Vega management requires systematic approaches rather than intuitive guesses. This means developing clear criteria for strategy selection, implementing disciplined risk management protocols, and maintaining detailed performance attribution analysis. The most successful volatility traders treat their approach as a business, with clear processes, defined risk parameters, and continuous improvement protocols.
Multi-Dimensional Thinking: Vega doesn't exist in isolation—it interacts with Delta, Gamma, and Theta in complex ways that create both opportunities and risks. Advanced practitioners think in terms of Greeks portfolios rather than individual positions, optimizing across multiple risk dimensions simultaneously. This multi-dimensional approach enables more robust strategy construction and superior risk-adjusted returns.
Market Regime Awareness: Volatility environments change, and successful Vega strategies must adapt accordingly. What works brilliantly in low volatility environments may be disastrous when volatility spikes. Developing the ability to recognize regime changes and adjust strategies accordingly separates consistently profitable traders from those who experience boom-bust cycles.
Technology Integration: Modern Vega management increasingly requires technological sophistication. From real-time Greeks monitoring to algorithmic risk management, technology enables precision and speed that manual approaches cannot match. However, technology should enhance rather than replace fundamental understanding—the most successful traders combine technological tools with deep market knowledge.
The Strategic Value of Volatility Expertise
In an increasingly complex financial landscape, volatility expertise provides unique competitive advantages. While traditional investment approaches often struggle during periods of market uncertainty, well-constructed Vega strategies can thrive precisely when other approaches falter. This creates portfolio diversification benefits that extend far beyond simple return enhancement.
Moreover, volatility expertise enables more sophisticated risk management across entire portfolios. Understanding how volatility affects different asset classes and developing the ability to hedge volatility risk creates more robust investment approaches. This is particularly valuable during periods of market stress, when correlations increase and traditional diversification benefits disappear.
Building Long-Term Volatility Alpha
Creating sustainable competitive advantage through Vega mastery requires continuous learning and adaptation. Markets evolve, new products emerge, and volatility patterns shift over time. The most successful practitioners maintain curiosity and adaptability, constantly refining their approaches based on new information and changing market conditions.
This learning orientation extends to understanding market microstructure, following regulatory developments, and staying current with technological advancement. Volatility markets are particularly dynamic, with new products and strategies emerging regularly. Those who stay at the forefront of these developments position themselves to capture opportunities that others miss.
Risk Management as Foundation
Throughout this exploration, we've emphasized that aggressive pursuit of volatility profits without corresponding risk management leads to eventual ruin. The leverage inherent in options strategies amplifies both profits and losses, making risk management not just important but essential for survival.
Effective risk management goes beyond simple position sizing—it encompasses portfolio-level thinking, correlation management, scenario planning, and stress testing. The goal isn't to eliminate risk but to ensure that risks taken are both understood and compensated. This requires developing intuitive understanding of how different strategies behave under various market conditions.
The Human Element
Despite increasing automation and technological sophistication, successful Vega trading still requires human judgment and decision-making. Markets are driven by human emotions and behaviors, creating patterns and opportunities that pure quantitative approaches may miss. The most successful volatility traders combine analytical rigor with intuitive market sense, using technology to enhance rather than replace human insight.
This human element becomes particularly important during periods of market stress, when historical relationships break down and unprecedented events occur. The ability to adapt quickly, think creatively, and maintain emotional discipline during volatile periods often determines long-term success.
Final Thoughts: Transforming Uncertainty into Opportunity
Volatility represents the heartbeat of financial markets—the constant pulse of uncertainty that drives price discovery and creates trading opportunities. Those who master Vega learn to hear this heartbeat clearly, understanding its rhythms and anticipating its changes. This transforms volatility from a source of anxiety into a reliable source of profit opportunities.
The strategies and concepts presented in this article provide a comprehensive foundation for volatility mastery, but true expertise comes only through practical application, continuous learning, and disciplined execution. The path from novice to expert volatility trader is challenging but rewarding, offering both intellectual satisfaction and financial returns for those willing to invest the necessary time and effort.
As markets continue to evolve and new challenges emerge, the fundamental principles of Vega management remain constant: understand the risks, position appropriately, manage dynamically, and never stop learning. Those who embrace these principles while adapting to changing market conditions will find themselves well-positioned to harness volatility for consistent portfolio optimization.
The opportunity to transform market uncertainty into strategic advantage awaits those ready to master the art and science of Vega. The tools, strategies, and insights needed for this transformation are now at your disposal—the journey toward volatility mastery begins with your next trade.
Have you incorporated Vega into your trading strategies? How do you manage volatility risk in your portfolio? The continuous evolution of volatility markets creates ongoing opportunities for those willing to adapt and learn.
Risk Disclaimer: This article is for educational purposes only and does not constitute financial advice. Options trading involves significant risk and may not be suitable for all investors. Volatility strategies can result in substantial losses, particularly when market conditions change rapidly. Always consult with qualified financial professionals and thoroughly understand all risks before implementing any options strategies. Past performance does not guarantee future results.